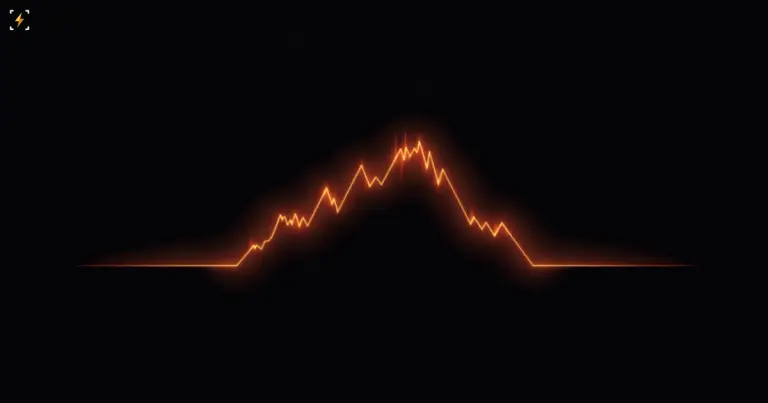
Bitcoin flashes the Bart Simpson pattern after a 25% August rally
Bitcoin has given back some of its sharp August rally, and the retreat is tracing a familiar outline on the chart, BeInCrypto reports: several analysts have flagged a Bart Simpson pattern forming on BTC.
- Bitcoin gained 25% in August and pushed through $80,000 late in the month, before trading near $77,281, down 1.42% over 24 hours
- The pattern takes its name from the cartoon character because the chart's sharp move, sideways drift, and snap-back resembles his hairline
- The setup would matter most if Bitcoin loses $75,800, a level one analyst flagged as the key threshold for confirming the bearish pattern
- Holding steady above $75,800 could invalidate the bearish setup and open room to retest the May high near $83,000
The chart pattern alone isn't the strongest signal here. Analyst CW8900 said spot demand has turned negative during the sideways move, with negative readings appearing on two consecutive days while futures demand held firm throughout the same stretch.
Without the support of spot demand, there is no bullish rally.
The distinction between spot and futures demand matters because it separates buyers who actually own the asset from traders betting on its price with leverage. Spot demand turning negative while futures demand holds up means the people buying and holding actual BTC are stepping back, even as speculative futures positioning stays active around them.
Separately, analyst Axel Adler Jr reported that long-term holder distribution rose 61.5% between August 18 and 28, with the 30-day sum climbing from 174,500 BTC to 281,900 BTC, the highest reading since the start of 2026. Adler linked the increase to the rebound after a short squeeze, which opened a window for long-term holders to take profit.
Adler also flagged inflation and labor data due over the next few days as the numbers that will shape the Fed's September decision, and by extension whether current demand can absorb the growing supply from long-term holders. That decision lands during a month with its own bad reputation on Wall Street too. The Bart Simpson pattern itself isn't a definitive bearish signal. It can show up during normal consolidation after a sharp move, and Bitcoin's recent history backs that reading: the token went through a similarly rough stretch in late August, swinging from an $81K high to a $77K low before climbing back. Whether this round follows the same script or breaks $75,800 instead depends on data still days away.
Nothing here should be taken as financial advice — just information to consider.

Author
MaksTrading man
I've been interested in the cryptocurrency market for a long time, am a trader, and write articles and news about my experience and crypto in simple terms.
Comments (0)
No comments yet — be the first!
Join our community
No spam, unsubscribe in one click
Related news

Claude: long documents, coding tool included, and what the tiers cost

Kraken Unified Wallet turns every EEA balance into margin, Earn included

Surface Laptop Ultra runs $2,599 to $5,899, and the petaflop is FP4
Most readTop 7

Silicon Valley Workers Are Wearing Noise-Cancelling Masks to Dictate AI Prompts
369AI

